Opportunity Cost

Opportunity Cost

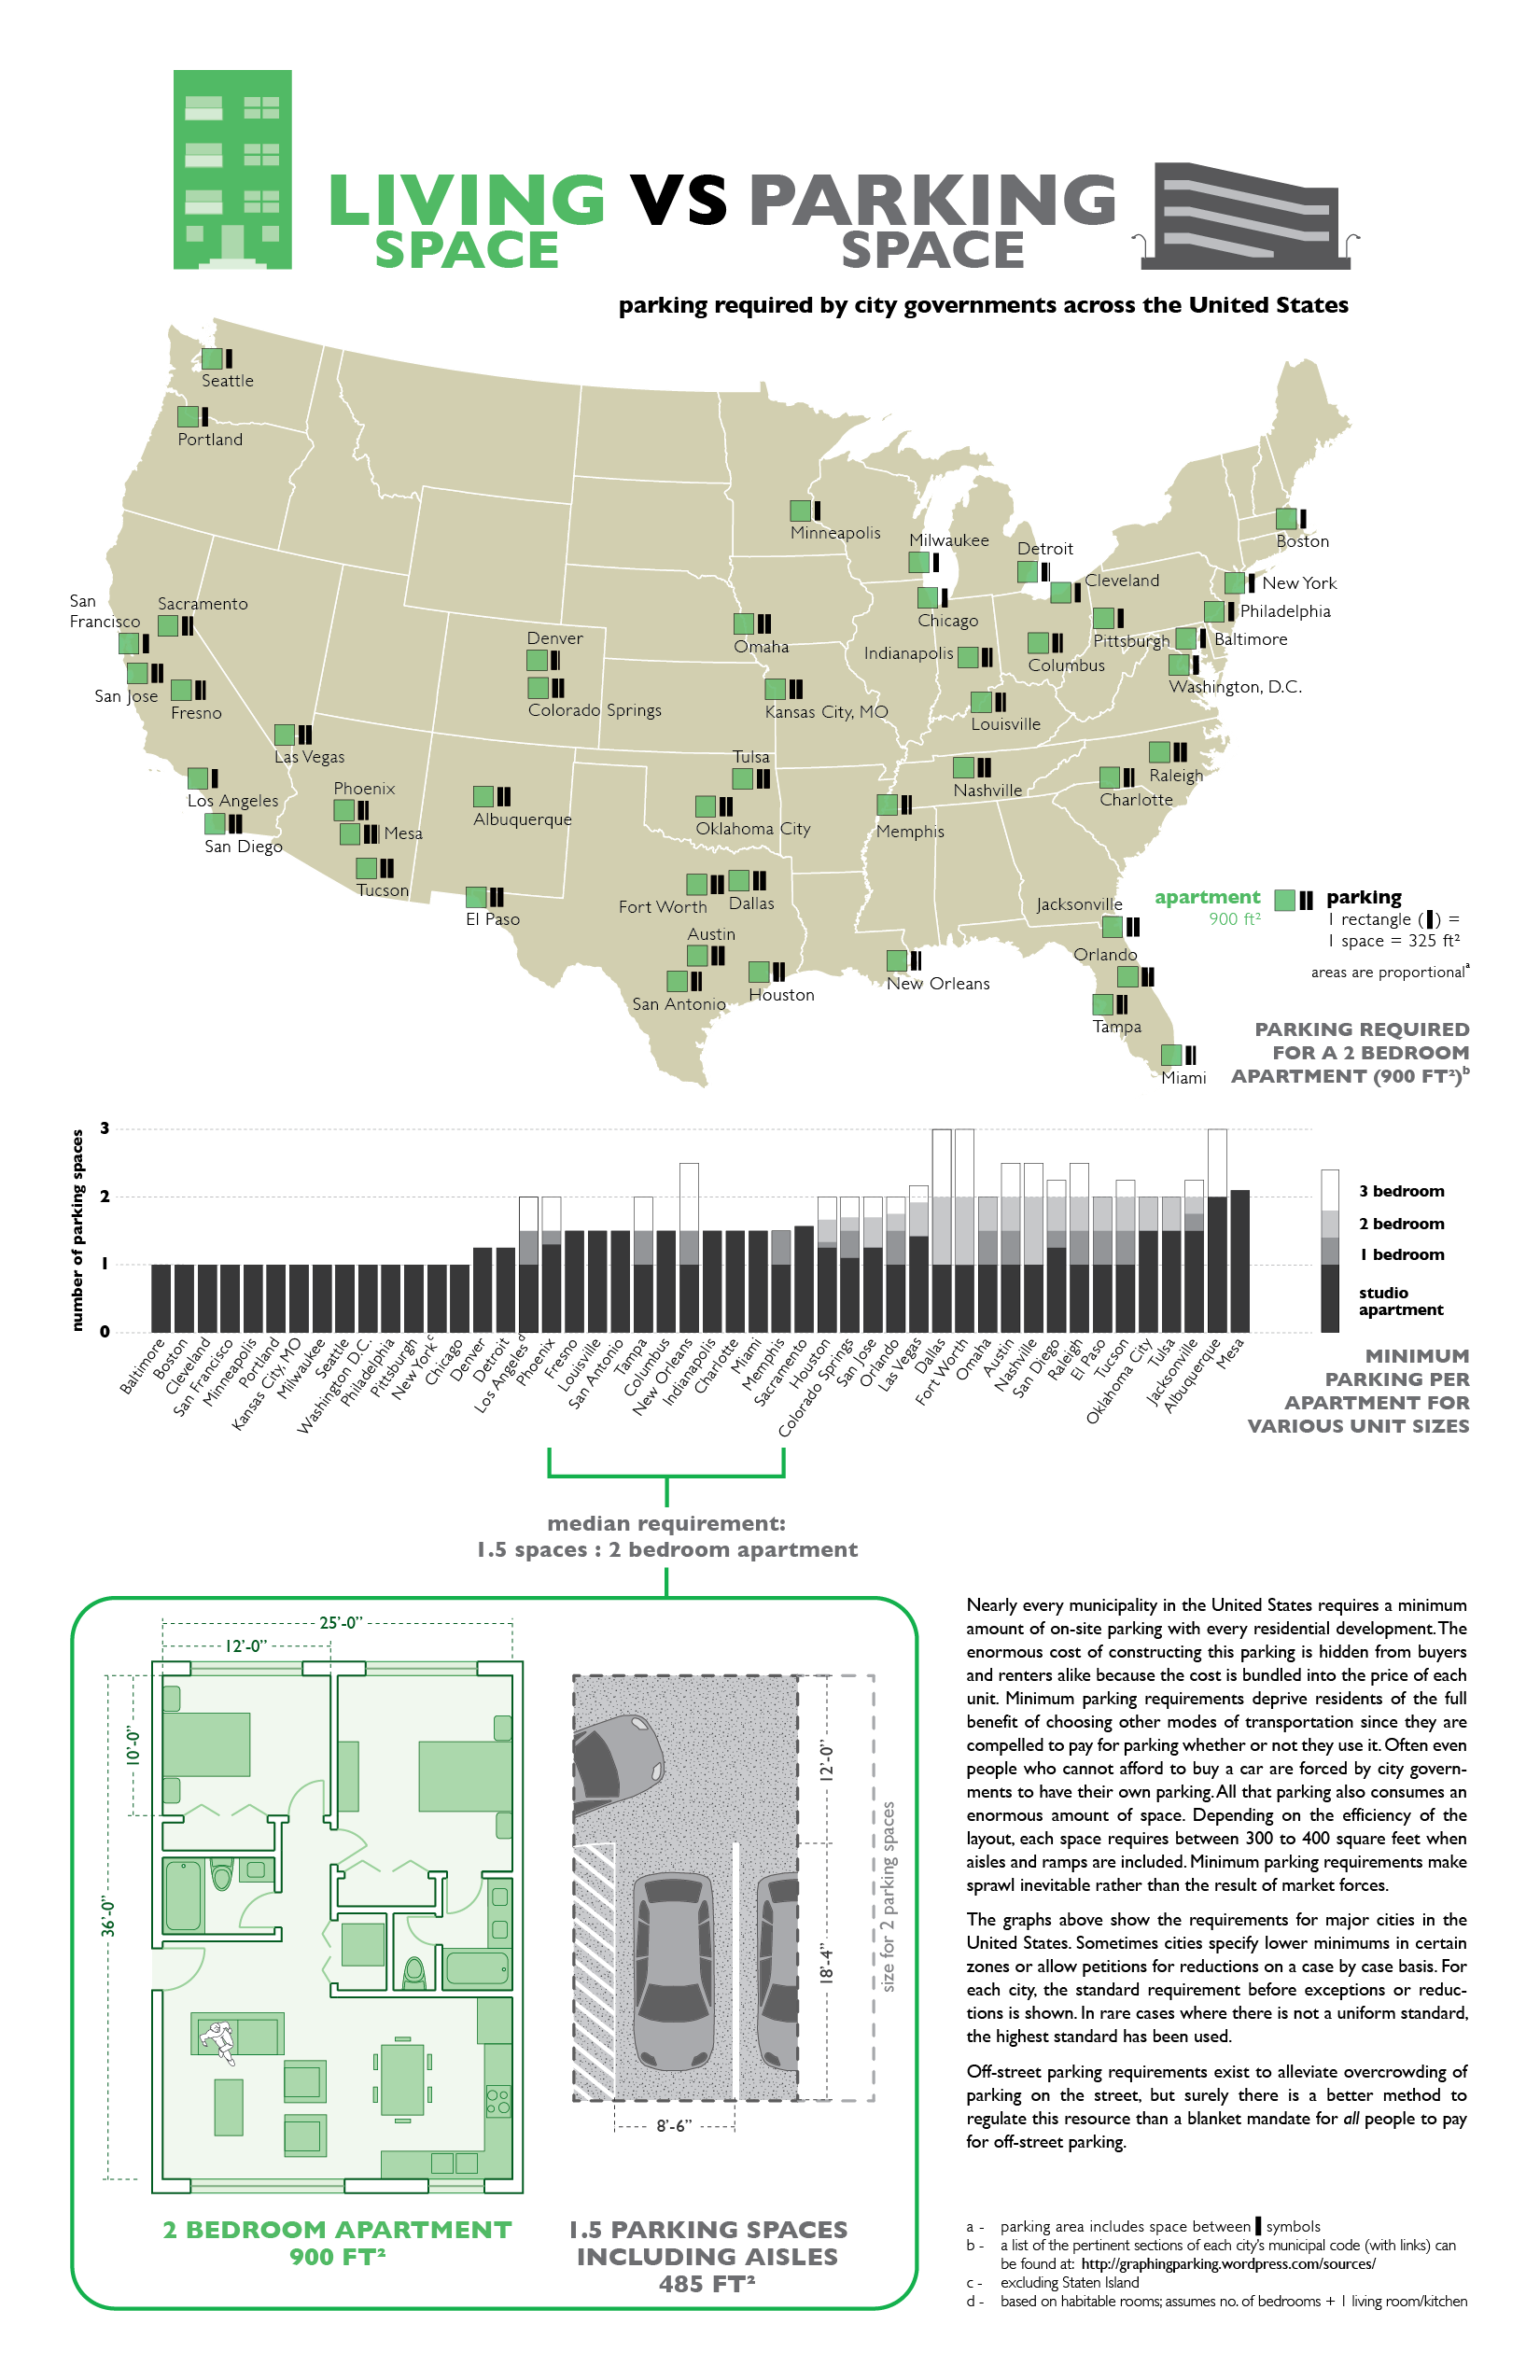
Sometimes data and reason aren’t enough to change people’s minds. For all the level headed arguments against parking minimums, about how current policy restricts housing supply and drives up costs, and about the unfairness of hidden subsidies for drivers at the expense of everyone else, the knee-jerk, emotional response resisting change will always be a powerful force. Those wishing to affect positive change have not only to construct reasoned arguments for it, but to tug on heartstrings as well. That’s the kind of appeal that The Sightline Institute made recently in the article “Ugly by Law”. It’s the kind of appeal that Park(ing) Day makes every year.  By seeing a vision of what could be, people will also view the world as it exists with new eyes. Many have become numb to car dominated landscapes and lifestyles. Providing a clear vision of what could have been and what we are missing out on, will bring to life the better world that will be if the space dedicated to cars can be right-sized. Showing images and examples of transformation from an on the ground, human perspective will be an important part of helping others to see that what exists now is not an inevitability, but a choice. What does our (institutionalized) obsession with cars cost us?

While the above graphic features the view from my apartment in Bogotá, Colombia, I hope it will have some universal appeal.

High resolution version

Advertisement

Parking across Cascadia

FINAL cascadia apartments landscape

With this post I am taking a brief detour from the inaugural series of Graphing Parking to feature a graph for the Sightline Institute’s ongoing series, “Parking? Lots!” Alan Durning has been leading this in-depth analysis focused on parking policy in Cascadia. I encourage everyone to check out the article as well as the previous three installments.

This graph is an adaptation of the earlier “Living Space vs. Parking Space” that I did for cities in the contiguous 48. Fortunately for me, Mieko Van Kirk and Pam MacRae of the Sightline Institute did the heavy lifting in researching each city’s requirements for this version.

I have a couple of observations I’d like to add:

Two things stood out for me especially. First the common suspicion that suburbs have higher parking requirements than their principal cities has been universally upheld here. Obviously this is just one land use in a sample that includes only three major metropolitan areas, so the graph doesn’t prove definitively that this holds true as a rule. Additionally, as you can see in the previous graphs, Seattle and Portland have some of the lowest minimums in the US, so it is unsurprising that the suburbs’ are a bit higher. Nevertheless, the fact that there is not a single exception says a lot. I would be interested to see if cities with already high requirements such as Albuquerque or Jacksonville have suburbs with yet higher parking minimums.

Second, this graph challenged my assumption that smaller stand-alone cities would behave just like suburbs. It’s actually a mixed bag. Spokane, Washington and Eugene, Oregon both mimic the requirements of the larger cities. It would take looking at various other uses to find out whether this similarity applies in general, but I will no longer take for granted that a relatively small (around 200,000 in the city proper) population automatically translates to higher requirements. If there are many more similar cases out there, it would go a long way towards demonstrating that cities don’t need Manhattan-like conditions to ease up on parking minimums.

Vector versions: Cascadia apartmentsCascadia apartments landscape

Residential Parking Requirements

apartments

This is the first of a five part series. My intention is to demonstrate the prevalence, scale, and inconsistency of parking requirements across the United States for various land uses. This will likely be the least dramatic of the series which will include requirements for restaurants, offices, schools, and places of worship. Even still, this graph starts to reveal regional differences. It also raises questions such as: why would a two bedroom apartment in Omaha need twice the parking as the same apartment in Kansas City, MO? I found the bar graph particularly interesting because cities seem to fall into one of three categories:

1) cities that require one parking space per apartment regardless of size

2) cities that require about one and a half parking spaces per apartment regardless of size

3) cities that have variable requirements but have the most onerous standards for multi-bedroom units

It would seem to me that cities in the first two categories might have a higher prevalence of multi-bedroom units than cities in the third category since the cost of parking could remain constant. One would think that especially in the case of Fort Worth, there would be very few three bedroom apartments. Might there also be an effect on the percentage of families with children that live in multi-unit dwellings? Perhaps young people would be more likely to live with roommates in cities that do not vary their requirements. It would be interesting to test these hypotheses but I’m not sure how to go about that.

Finally, the plans at the bottom of the infographic demonstrate just how big all that parking really is, while hinting at the opportunity cost of building it. Could the person sitting on the couch have afforded an additional bedroom or study if not for the parking? Maybe a balcony or garden space could have replaced the pavement…

An editable PDF version is available here. I invite you to use it freely but ask that you attribute the work.

Updated: 31 March 2013 to reflect more recent source on Dallas