Opportunity Cost

Opportunity Cost

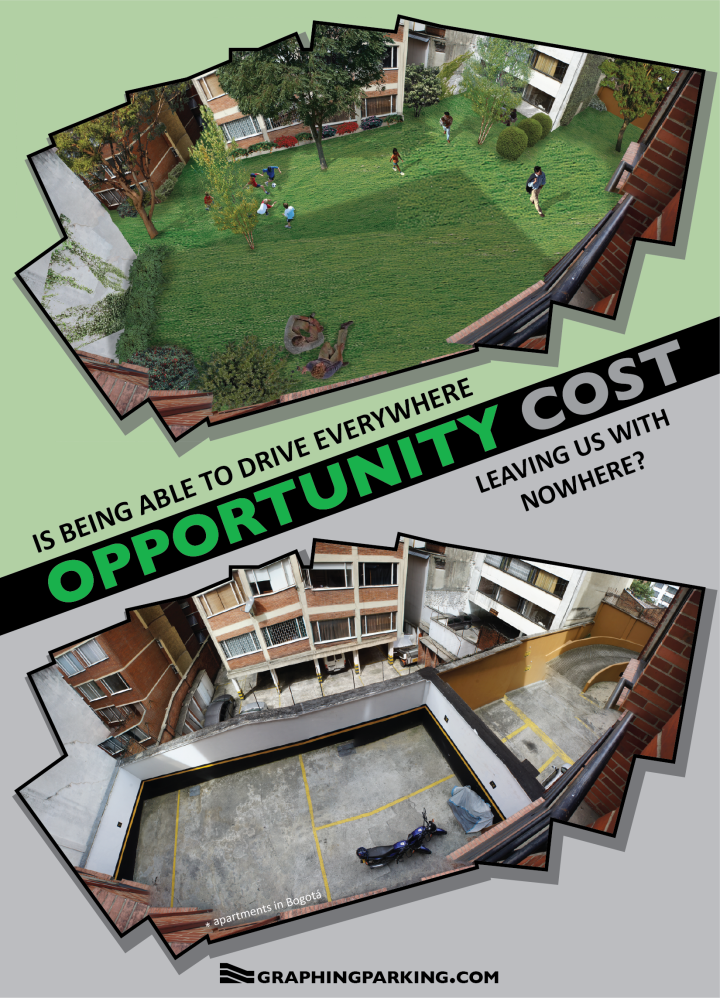
Sometimes data and reason aren’t enough to change people’s minds. For all the level headed arguments against parking minimums, about how current policy restricts housing supply and drives up costs, and about the unfairness of hidden subsidies for drivers at the expense of everyone else, the knee-jerk, emotional response resisting change will always be a powerful force. Those wishing to affect positive change have not only to construct reasoned arguments for it, but to tug on heartstrings as well. That’s the kind of appeal that The Sightline Institute made recently in the article “Ugly by Law”. It’s the kind of appeal that Park(ing) Day makes every year.  By seeing a vision of what could be, people will also view the world as it exists with new eyes. Many have become numb to car dominated landscapes and lifestyles. Providing a clear vision of what could have been and what we are missing out on, will bring to life the better world that will be if the space dedicated to cars can be right-sized. Showing images and examples of transformation from an on the ground, human perspective will be an important part of helping others to see that what exists now is not an inevitability, but a choice. What does our (institutionalized) obsession with cars cost us?

While the above graphic features the view from my apartment in Bogotá, Colombia, I hope it will have some universal appeal.

High resolution version

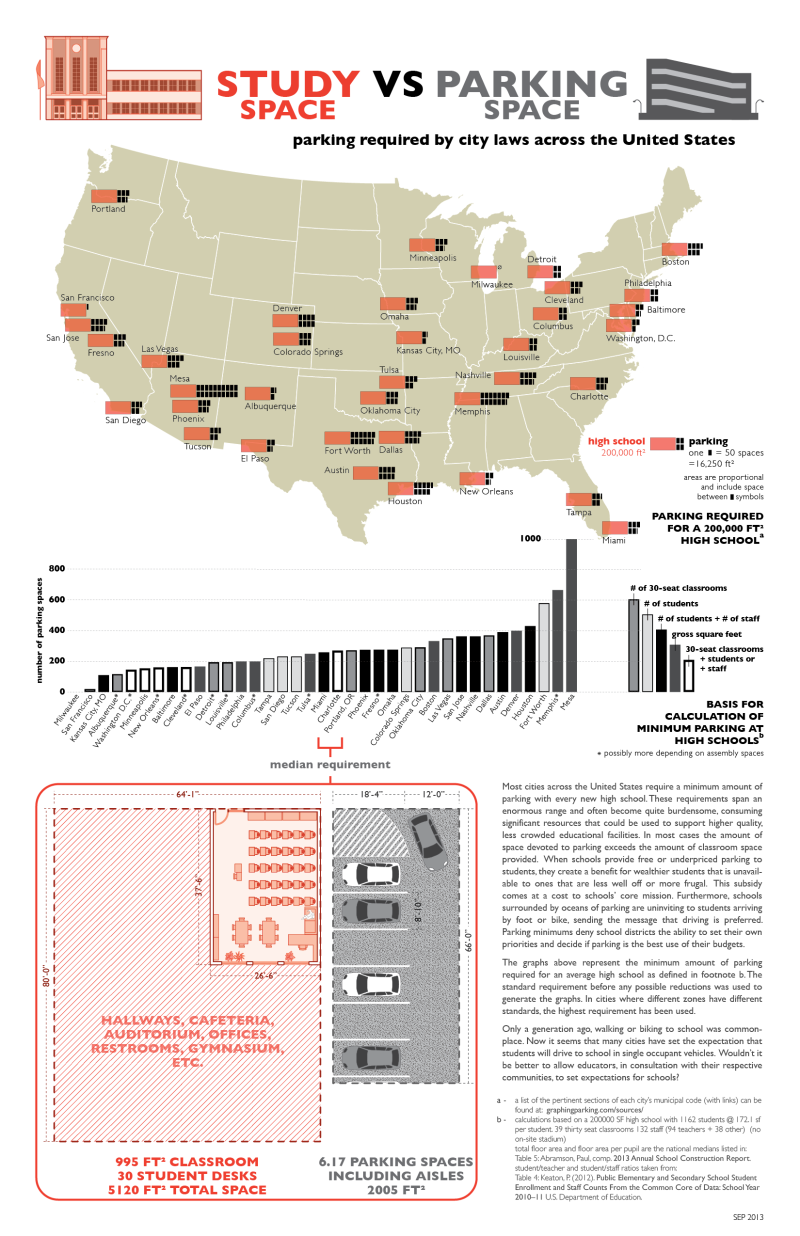
Parking for High Schools

high school

This is the final installment of a five part series documenting parking minimums across the United States. Future graphs will explore parking minimums on a more local and conceptual level and will eventually include on-street parking policy as well.

There is no consensus on how to calculate minimum parking for high schools. The methods are so varied that I ended up leaving several cities off of this graphic in an effort to simplify comparisons. Still, despite my best efforts to use current national averages to build a fair basis of comparison, the numbers shown and the corresponding ranks of each city represent only one possible scenario and could shift significantly if different assumptions were used about student and staff population, built area, and/or the number of classrooms. The real lesson from this graph is the haphazardness with which minimums are calculated and the huge consequences for cities like Mesa that get it horribly wrong. Providing plentiful free parking to high school students gets them hooked on driving from an early age. It sets the expectation that driving is a rite of passage into adulthood and that any other method of getting around is immature or inferior. In a country with an obesity epidemic, that doesn’t seem to be the best lesson to teach. In a setting where equality should be a virtue, it provides a benefit to wealthier students, who have the means to drive a car, with funds that could go towards providing students (including those less well off) with a higher quality education.

Continue reading

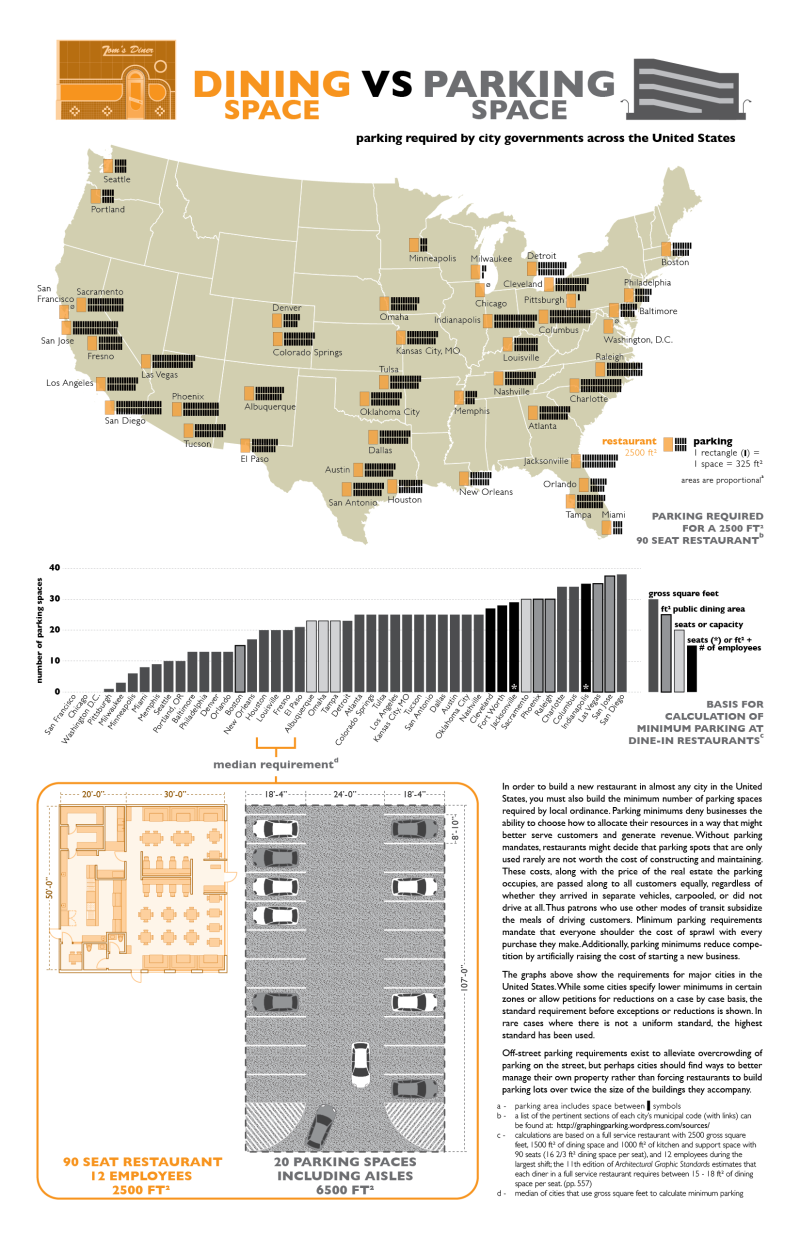
Parking Requirements for Restaurants

restaurant 2500sf

This is part two of the five part series documenting parking minimums for various land uses in cities across the United States. I found the graphs above to be quite stunning and while I was working on them I often had to remind myself that these are not worst case scenarios, these are minimums. Much more so than the previous entry on apartments, this set of graphics illuminates the huge amount of real estate that city governments require to be set aside for parking. The spacial mismatch between cars and people is jarring, and it becomes obvious that creating a humane, walkable urban environment is totally impossible so long as these ordinances stand.
Continue reading