
This is part two of the five part series documenting parking minimums for various land uses in cities across the United States. I found the graphs above to be quite stunning and while I was working on them I often had to remind myself that these are not worst case scenarios, these are minimums. Much more so than the previous entry on apartments, this set of graphics illuminates the huge amount of real estate that city governments require to be set aside for parking. The spacial mismatch between cars and people is jarring, and it becomes obvious that creating a humane, walkable urban environment is totally impossible so long as these ordinances stand.
Equally important, the vast discrepancies between different cities’ standards begins to emerge more clearly and suggests the haphazardness and lack of clear reasoning behind specific requirements. A couple of comparisons stood out to me in particular. Why, one wonders, does Nashville require over two and a half times the parking of Memphis? Is there really such a vast difference from middle to western Tennessee? What about Pittsburgh vs. Columbus? Perhaps Pittsburgh is inundated with overflow parking while Columbus features perfectly unclogged streets. I’ve never been to either city, so I must plead ignorance.
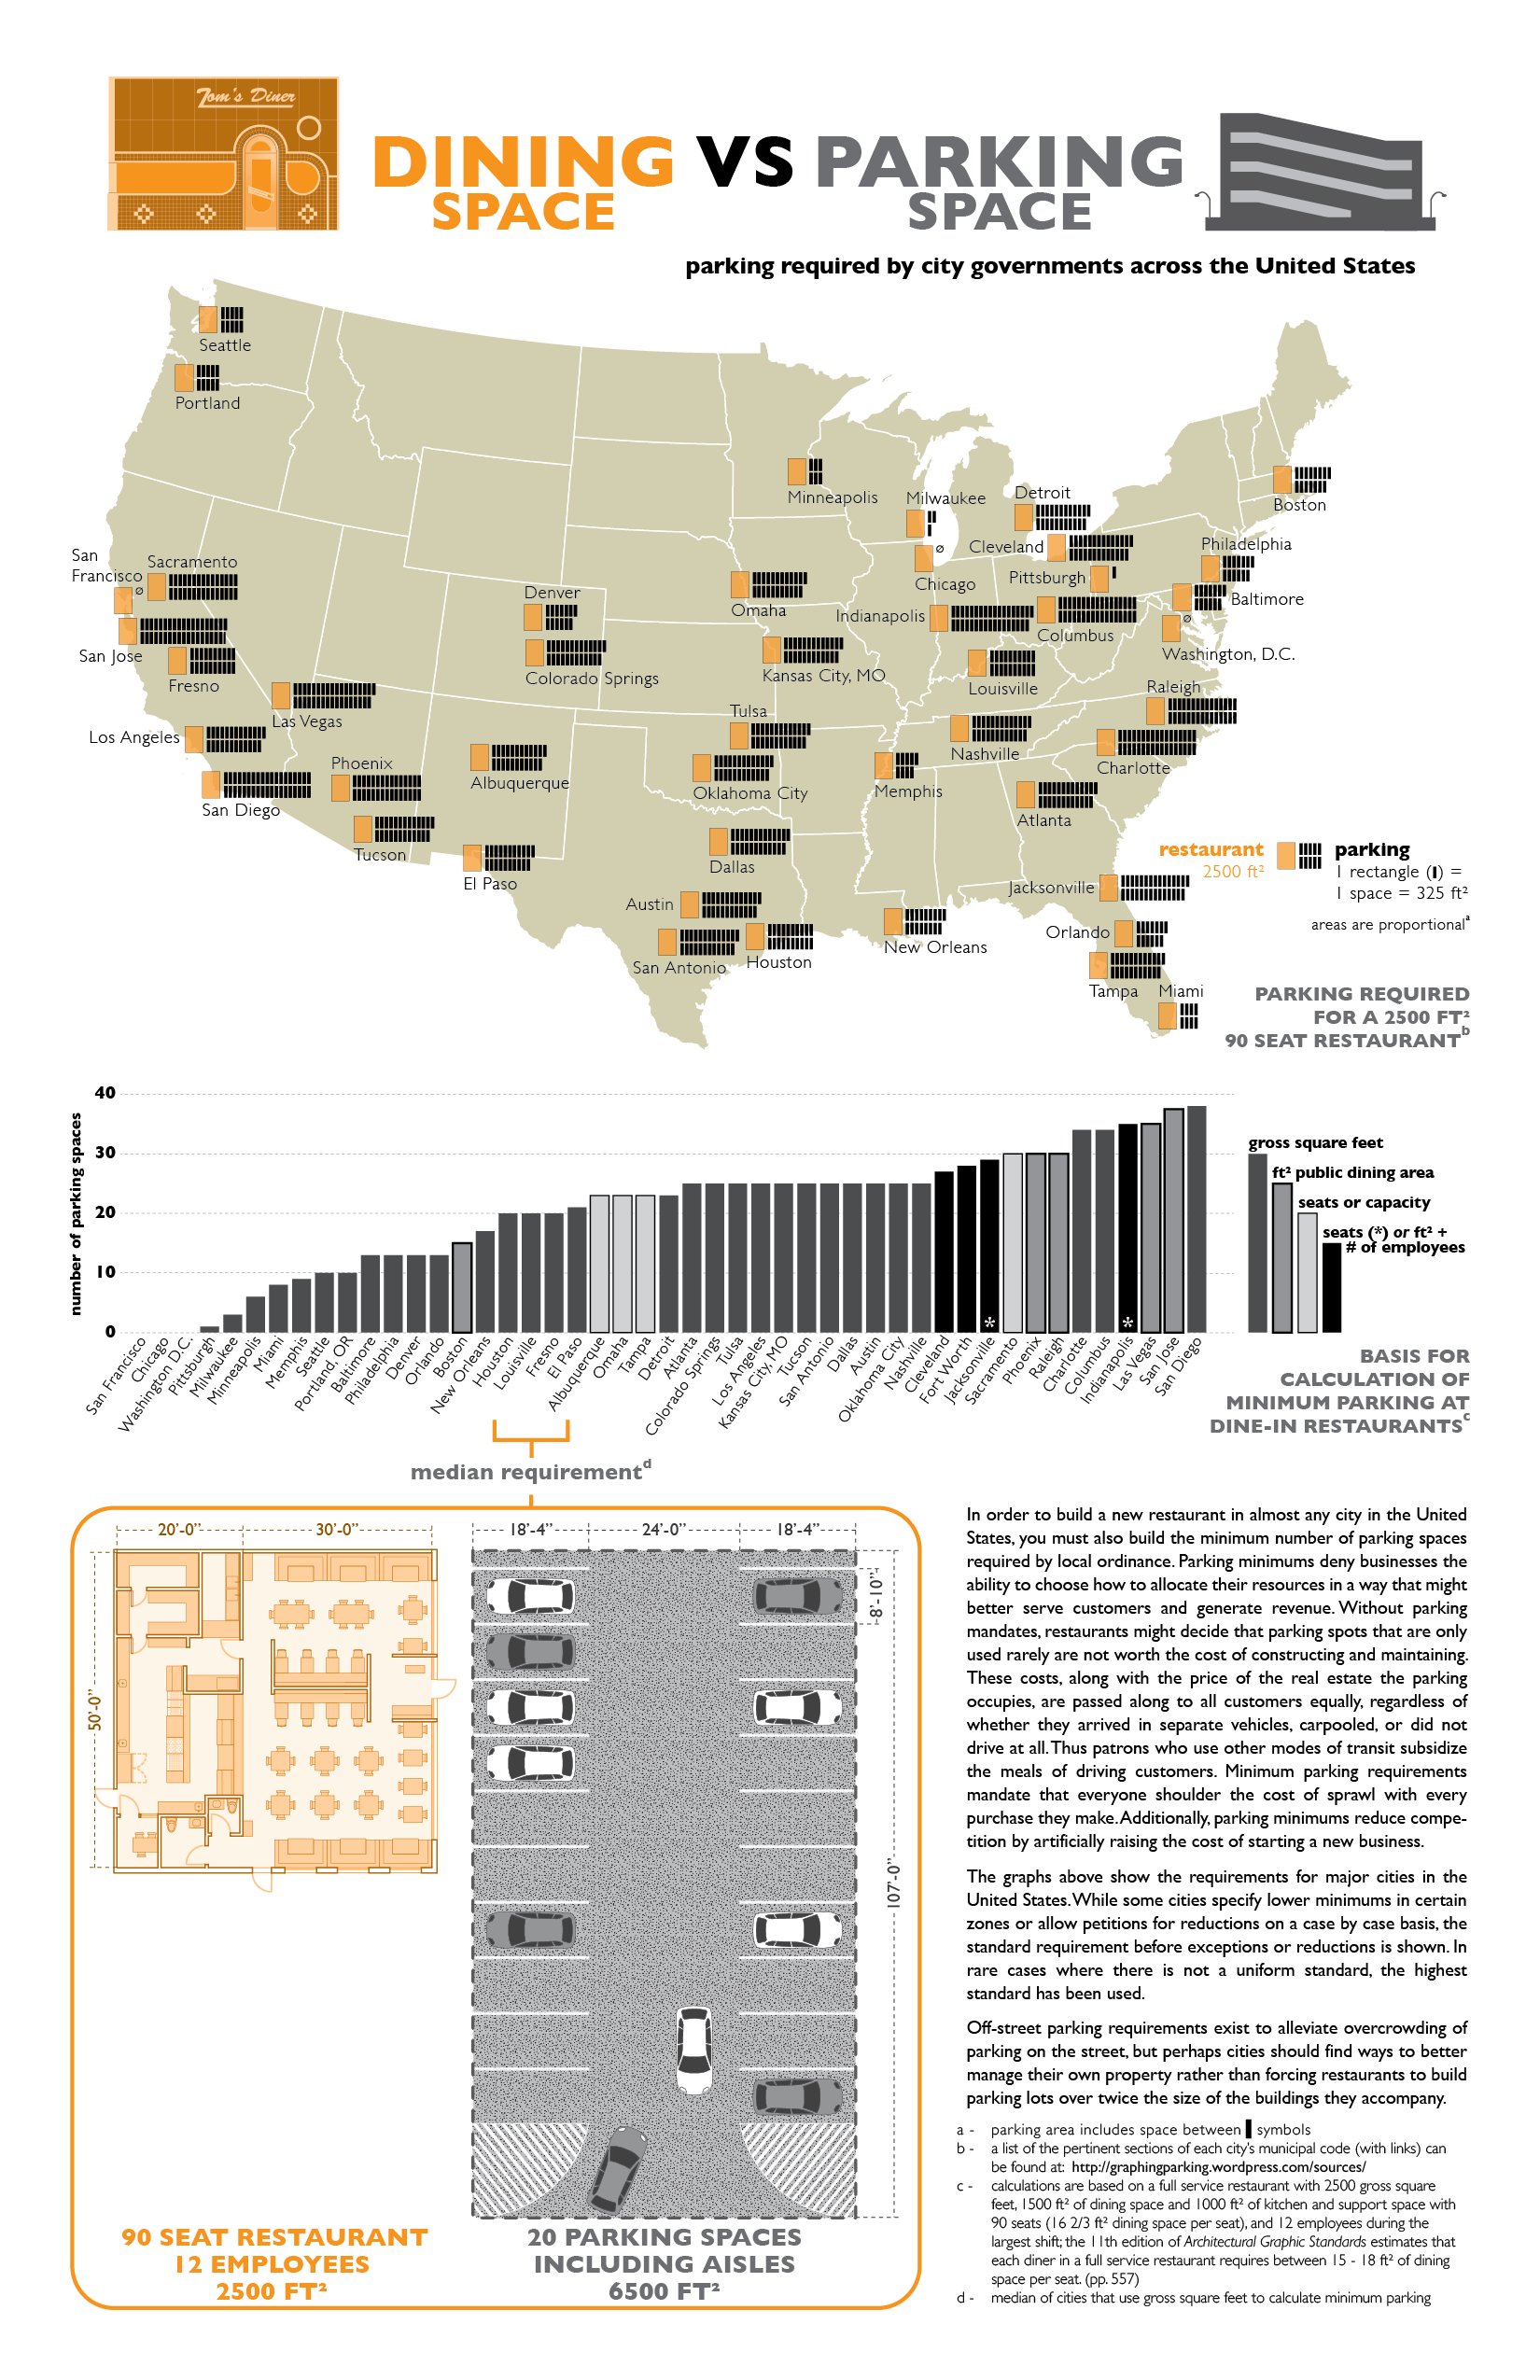
Also notable about parking minimums for restaurants are the different methods by which cities calculate the requirements. I had a hard time trying to make a fair comparison between cities because of this, but I believe that my example is a just representation of a typical restaurant. Nevertheless, if my assumptions about the seating capacity, staffing, or kitchen to dining space ratio are off, it would change the relationships between some cities. The different bases of calculation might discourage or encourage certain kinds of restaurants over others. For example, cities that base their standard on public dining space would put an especially high burden on fine dining establishments that tend to have more dining space per patron than more affordable restaurants. On the other hand, those that count seats might discourage restaurants with high density seating typical of inexpensive diners. It’s interesting to note that these alternative methods of calculating minimums (that is, those not based on gross square footage) tend to cluster on the bar graph, suggesting that these cities are copying one another’s requirements. They don’t however seem to cluster geographically.
The next installation isn’t likely to be ready for quite some time, and I probably won’t begin promoting the blog until I have a little more material, but I hope that these first two graphics have been interesting for those who have managed to stumble upon them.
As will always be the case, I offer a vector version (PDF) of the graphic here: restaurant 2500sf


Pingback: Visualizing America’s Absurd Parking Requirements | Streetsblog Capitol Hill
What I would be interested in knowing are the costs per stall for grade level parking [including uncovered and covered], as well as below grade parking garage…
I am the chamber president in Kanab Utah and I need help with these very ordinances.
Pingback: » American parking requirements: Massive (mostly), arbitrary, and costly SSTI